Smoothing

Like any captured signal, photographic images often suffer from the presence of noise. Noise produces variations in the captured signal that do not occur in the natural signal. That is, noise is introduced somewhere in the process of capturing the signal. It is usually viewed as an unwanted corruption of the signal, therefore the modeling and elimination of noise is an important part of signal processing. Noise can occur in a pattern, or be complex enough that it is modeled as a random phenomenon.

Noise can have many difference causes, and therefore manifest itself in many different ways. “Salt and pepper” noise is the term given to noise which causes the value of the signal at a particular point to be a random value. This has the effect of causing random spikes in the captured signal, regardless of the original signal, often called impulse noise. Quantizing the signal may cause noise as it is effectively assigning a particular value to a range of possible values, and therefore modifying the original values in a certain pattern. A common type of noise in amplified signals is Gaussian noise. The noise factor can be thought of as a random variable that follows a normal, or Gaussian, distribution. The noise factor can be added to the pixel value, called additive noise, or multiplied with the pixel value, multiplicative noise. When dealing with a potentially noisy signal it is often sufficient to take Gaussian noise into account to get acceptable results. Gaussian noise occurs in digital imagery as fluctuations in intensity values of the image. The noise is pixel-independent, meaning that the change in a pixel value is independent of the change in any other pixel value. It is also independent of the original intensity at each pixel. Since Gaussian noise is common and relatively simple it is commonly taken into consideration in generalized signal processing methods.

Noise can contribute noticeable artificial components to the image signal. Smoothing or blurring is a type of operation which attempts to eliminate the noise while preserving the structure of the image. The primary way this is accomplished is through the use of neighborhood filters. These are kernels, or matrices, which are convolved with the image in order to achieve some transformation, in this case smoothing.

One assumption we may be able to make is that the value of a pixel is relatively similar to the value of the neighboring pixels. Therefore, averaging together the pixel values in a small neighborhood should preserve the structure of the image while attenuating the effects of outlier values (the noise). This methods is called average smoothing, and is accomplished by convolving the image with a kernel in the following form, called a box filter:

Figure 1. Average Kernel

One issue with the box filter is that its rectangular window produces undesirable effects in the frequency domain. A Gaussian smoothing kernel provides a much better approximation of ideal smoothing. Intuitively the idea is that the neighboring pixels which are closer to the target pixel are weighted more heavily in the average than the pixels farther away. The weight coefficients follow a Gaussian distribution, producing a filter like the one shown in Figure 1. The Gaussian filter is desirable because of its gradual cutoff, producing a Gaussian distribution in the frequency domain as well which delivers smooth monotonically decreasing attenuation of higher frequencies. A Gaussian distribution has infinite width, however, the tails approach zero relatively rapidly so a few standard deviations of width are sufficient for accurate results.

gaussianeq

Figure 1. Gaussian Smoothing Kernel

Figure 2 shows a sample image and Figures 3, 4, & 5 show the effects of successively larger Gaussian smoothing kernels.


Figure 2. Sample Image


Figure 3. 3x3 Gaussian Blur
Figure 3. 3x3 Blur


Figure 4. 5x5 Gaussian Blur
Figure 4. 5x5 Blur


Figure 6. 10x10 Gaussian Blur
Figure 5. 10x10 BlurÂ

Read More

Convolution Transforms

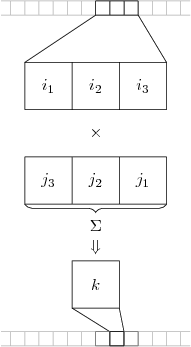
In a previous article we discussed the idea of the convolution sum as a way to filter a signal when we know the desired impulse response. Convolution is a widely used technique in image processing to apply transformations to the signal. Since images are two-dimensional functions the impulse response is also two-dimensional, a matrix commonly called a kernel. Kernels often apply transformations to small neighborhoods of pixels, but as they are swept across the entire image the image as a whole is transformed. Figure 1 shows a one-dimensional convolution operation, while Figure 2 shows a two-dimensional convolution.

Figure 1. One-Dimensional Convolution
Figure 2. Two-Dimensional Convolution

Here the values of represent the intensity values of the signal, while the values of represent the values of the kernel. Notice that the arrangement of the kernel values are reversed. Recall the formula for the convolution sum:

So the first value of the image neighborhood is multiplied with the last value of the kernel . The result of the convolution is the intensity value of the output signal at the center point of the neighborhood. To determine the output value at the convolution formula will take on the form .

In this way the kernel is “swept” across the image to determine the output value at each position. A problem arises when convolution is considered near the edges of the signal in a finite signal. For example, to determine the value of the convolution sum will require some values of which are not available (e.g., , etc) depending on the size of the kernel. What should be used in place of these values? There are several common approaches for dealing with this problem, called padding. The signal may be padded with enough zeros to satisfy the convolution sum, or the intensity values of the edge pixels may be replicated. Another approach is to mirror the pixel values about the edge, or to periodically repeat the pixel values. The resulting output signal will have a length of , where is the length of the input signal and is the length of the kernel. However, the only part of the output signal that is considered valid, that is does not contain padded values, the central part of the signal of length .

Cross-correlation is an operation similar to convolution, except it does not reverse the kernel when multiplying. Cross-correlation is often used to identify a the location of matching signals. A smaller signal is swept across a larger signal, when the signal is matched the values will be fully correlated resulting in maximal output.

Read More

Derivative Operations

One fundamental class of operations that can be performed to extract information from a signal is that of derivative operations. Just as derivatives are used in calculus to extract features of a curve or surface, the same ideas can be applied to a signal.

The first problem we have is that of taking the derivative of a discrete-time signal. Discrete-time signals are not continuous and are non-differentiable. However, we do know that if the Nyquist Rate was met when sampling, the continuous-time signal should be reconstructable from the discrete-time signal using the ideal sync. In order to reconstruct the continuous-time signal, the discrete-time signal is convolved with the ideal sync, . So if we want the derivative of the continuous time signal, we can start by taking the derivative of both sides of this equation.

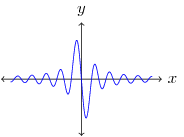
So the derivative of the continuous-time signal is equal to the convolution of the discrete-time signal with the derivative of the ideal sync. If instead the discrete-time signal is convolved with the sampled derivative ideal sync, this will result in a sampled derivative of the continuous-time signal, . The derivative of the ideal sync is shown in Figure 1. The major problem with this approach is that the derivative of the ideal sync is infinite and does not fall off rapidly.

Figure 1. Derivative of Ideal Sync

Designing filters to approximate the discrete-time derivative of the ideal sync are beyond the scope of this article, but several popular techniques will be described later.

If we want to apply derivative operations to an image we will have to extend this idea into 2-dimensional space. Using partial differentiation and a 2-dimensional ideal sync results in the following derivatives for :

The 2-dimensional ideal sync is said to be separable since it can be separated into its 1-dimensional components, . Again, these continuous-time derivatives of the ideal sync must be sampled. The horizontal and vertical derivative filters are denoted and , respectively.

The most basic approach to approximating is to use a version of the difference operator, that is, a sum of scaled differences of the samples, such as . This is accomplished by convolving with and amounts to an approximation of the derivative. Figure 2 shows an example of a row of pixel values from an image, while Figure 3 shows the derivative approximation of the pixel values and Figure 4 shows the second derivative. The locations where the intensity values change the most rapidly are represented by local peaks in the first derivative and zero-crossings in the second derivative. Note that taking the derivative extends the range of intensity values to allow negative values.

Figure 2. Original Intensity Values
Figure 3. Derivative
Figure 4. Second Derivative

If we think of the partial derivatives in each dimension as a component of a vector, this vector will represent the rate of change of the signal and the direction. This is called the gradient of the signal:

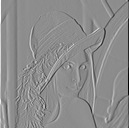
The gradient is a vector field where the direction of the vector at each point represents the direction of maximum change, while the magnitude of the vector represents the amount of change. As with other vectors, the magnitude can be calculated as , and the direction as . Given filters in the x and y directions, we can also construct a filter for an arbitrary direction, . Figure 4 shows a sample image and Figures 5 & 6 show the partial derivatives with respect to x and y respectively.

Figure 4. Sample Image
Figure 5. Sample Image
Figure 3. Horizontal Gradient
Figure 6. Horizontal Partial
Figure 4. Vertical Derivative
Figure 6. Vertical Partial

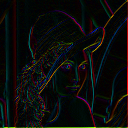
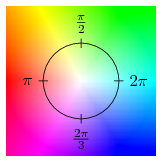
Figure 7 shows both the magnitude and the direction of the gradient of the sample image using the colormap in Figure 8. The partial derivative with respect to any direction, not just horizontal and vertical, can be calculated by multiplying a vector with the gradient, .

Figure 7. Gradient
Figure 7. Gradient
Figure 8. Colormap
Figure 8. Colormap

A useful tool when dealing with the second derivatives is the Hessian matrix which combines the derivatives into a matrix of the following form:

hessian

Where is the partial derivative of with respect to , i.e. the second derivative. To calculate the second derivative with respect to two vectors we can use the Hessian: .

Read More

Basic Image Processing

Basic image enhancement techniques allow us to manipulate an image to increase or decrease contrast and brightness. These techniques usually take the form of point-wise operations, meaning they act independently on each pixel of the image. An image is represented as a function mapping a pixel in 2-dimensional space to an intensity value, . The quantization method used when capturing the signal will determine the range of possible intensity values and their numeric representation, but will we assume that intensity values lie in the range [0,1]. Some types of images, such as color images, have more than one intensity spectrum or image plane, these are typically denoted as separate functions, such as , , and . Point-wise image operations can be performed using a transfer function that maps one set of intensity values to another set of intensity values, . This function can also be implemented as a lookup table, or LUT, when it is convenient.

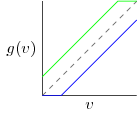
Linear functions are the most simple, although they typically involve undesirable clamping effects. To adjust the brightness of an image uniformly increase or decrease the intensities. The green line in Figure 1 represents an increase in brightness, while the blue line is a decrease. The dashed line is called the direct mapping, where the input of the function is directly mapped to the output, these are the original values. You can see that in order to keep intensity values within the [0, 1] range the higher end needs to be clamped when you increase brightness, and the lower end clamped when decreasing brightness. This has the effect of mapping multiple intensity values to the same value discarding information and creating and “washed out” look in the image.

Figure 1. Brightness Adjustment

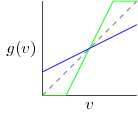
Increasing or decreasing contrast can be accomplished by increasing or decreasing the slope of the transfer function. A slope of 0 turns the function into a horizontal line which maps all intensity values to the same value. A slope of creates a vertical line which maps the intensity values to just 2 values. This is called segmenting the image and the point at which the line crosses the -axis is called the threshold. All intensity values below the threshold are mapped to a certain intensity, while all the intensities values above the threshold are mapped to another. This creates a binary image with only two intensity values.

Figure 2. Contrast Adjustment

Linear operations can be combined to adjust brightness and contrast with the same transfer function. We can also decrease the amount of quantization using a step function. A step function with only two steps behaves the same as the thresholding technique described above creating a binary image.

Non-linear functions are also useful for adjusting images. We may want to adjust the middle part of the transfer function but keep the endpoints at and . Gamma correction is a non-linear transfer function which affects the middle of the curve more than the endpoints. Note that the curve does not affect both sides of the gray-level symmetrically.

Figure 3. Gamma Correction

Read More