Basic image enhancement techniques allow us to manipulate an image to increase or decrease contrast and brightness. These techniques usually take the form of point-wise operations, meaning they act independently on each pixel of the image. An image is represented as a function mapping a pixel in 2-dimensional space to an intensity value, . The quantization method used when capturing the signal will determine the range of possible intensity values and their numeric representation, but will we assume that intensity values lie in the range [0,1]. Some types of images, such as color images, have more than one intensity spectrum or image plane, these are typically denoted as separate functions, such as , , and . Point-wise image operations can be performed using a transfer function that maps one set of intensity values to another set of intensity values, . This function can also be implemented as a lookup table, or LUT, when it is convenient.
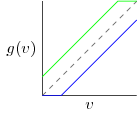
Linear functions are the most simple, although they typically involve undesirable clamping effects. To adjust the brightness of an image uniformly increase or decrease the intensities. The green line in Figure 1 represents an increase in brightness, while the blue line is a decrease. The dashed line is called the direct mapping, where the input of the function is directly mapped to the output, these are the original values. You can see that in order to keep intensity values within the [0, 1] range the higher end needs to be clamped when you increase brightness, and the lower end clamped when decreasing brightness. This has the effect of mapping multiple intensity values to the same value discarding information and creating and “washed out” look in the image.

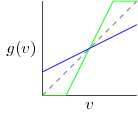
Increasing or decreasing contrast can be accomplished by increasing or decreasing the slope of the transfer function. A slope of 0 turns the function into a horizontal line which maps all intensity values to the same value. A slope of creates a vertical line which maps the intensity values to just 2 values. This is called segmenting the image and the point at which the line crosses the -axis is called the threshold. All intensity values below the threshold are mapped to a certain intensity, while all the intensities values above the threshold are mapped to another. This creates a binary image with only two intensity values.

Linear operations can be combined to adjust brightness and contrast with the same transfer function. We can also decrease the amount of quantization using a step function. A step function with only two steps behaves the same as the thresholding technique described above creating a binary image.
Non-linear functions are also useful for adjusting images. We may want to adjust the middle part of the transfer function but keep the endpoints at and . Gamma correction is a non-linear transfer function which affects the middle of the curve more than the endpoints. Note that the curve does not affect both sides of the gray-level symmetrically.
