Usually when a signal is captured the domain is either temporal or spatial. For example, an audio signal from a microphone measures changes in air pressure (sound waves) over time, thus the measurements are in the time domain. An image sensor takes measurements from an array of photoreceptors, thus the signal exists in the spatial domain. A video signal is both in the time domain and the spatial domain. It can be helpful to deal with a signal in different domains, for example the frequency domain. Here the value of a signal at a given point represents the contribution to the signal from a sinusoid at a certain frequency. So instead of representing an amplitude at time , it represents the contribution to the signal by a sinusoid at frequency . The Fourier Transform transforms a signal into the frequency domain.
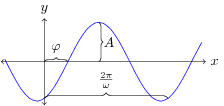
A sinusoid is any function that takes the form , where is the amplitude, is the angular frequency, and is the phase, as shown in Figure 1. The angular frequency is measured in radians per second, therefore is one full cycle, sometimes denoted for frequency, in cycles per second or hertz (Hz). One full cycle is called the period, .

Another way of representing a sinusoid is with a complex exponential, in the form . Euler’s formula tells us that this is equal to a complex number where the real part is and the imaginary part is . Just as we can represent a discrete-time signal as a linear combination (scaled, shifted) of unit impulses, a periodic discrete-time signal can be expressed as the linear combination of sinusoids. The Discrete-Time Fourier Transform, or DTFT, decomposes a discrete-time signal into the composite sinusoids. The sinusoids act as a basis set for the signal, in the same way that the and vectors form the basis set for 2-dimensional Cartesian space. The DTFT is given in the following equation:
In my previous article I mentioned that the discrete-time signal is derived from a continuous signal in the form , where is the sampling period. The inverse of the sampling period is the sampling frequency, which corresponds to the number of samples per second. Due to limitations of sampling a continuous signal, we often represent the frequencies in relation to the sampling frequency. This is called a normalized frequency, in terms of hertz it is the number of cycles per sample, equal to , or in terms of angular frequency it is the number of radians per sample, equal to . Since radians are a unit-less measurement the normalized angular frequency is sometimes referred to as inverse samples. For example, the following signal in Figure 2 can be decomposed into the sinusoids at the frequencies plotted in Figure 3; the sinusoids themselves are shown in Figure 4.


The Fourier series allows us to perform an inverse Fourier Transform to reconstruct a time-domain signal from the composite sinusoids using the complex exponential form:
Since the frequency domain representation is a sum of scaled complex exponentials, it is a complex function. The magnitude represents the amplitude of the sinusoid, while the angle or argument represents the phase.
Consider an LTI system with impulse response and output given inputs in the form of a complex exponentials:
In the last equation above, the function is called the frequency response of the system. We can see that is the Fourier transform of the impulse response . Also, instead of convolving the frequency response with the input, it is multiplied. In general we can relate the time-domain signals to their frequency domain representations as follows:
One thought on “Fourier Transforms”
Comments are closed.